For: CRMDAY One users with the Insurance profile.
Recipe: insurance line by status
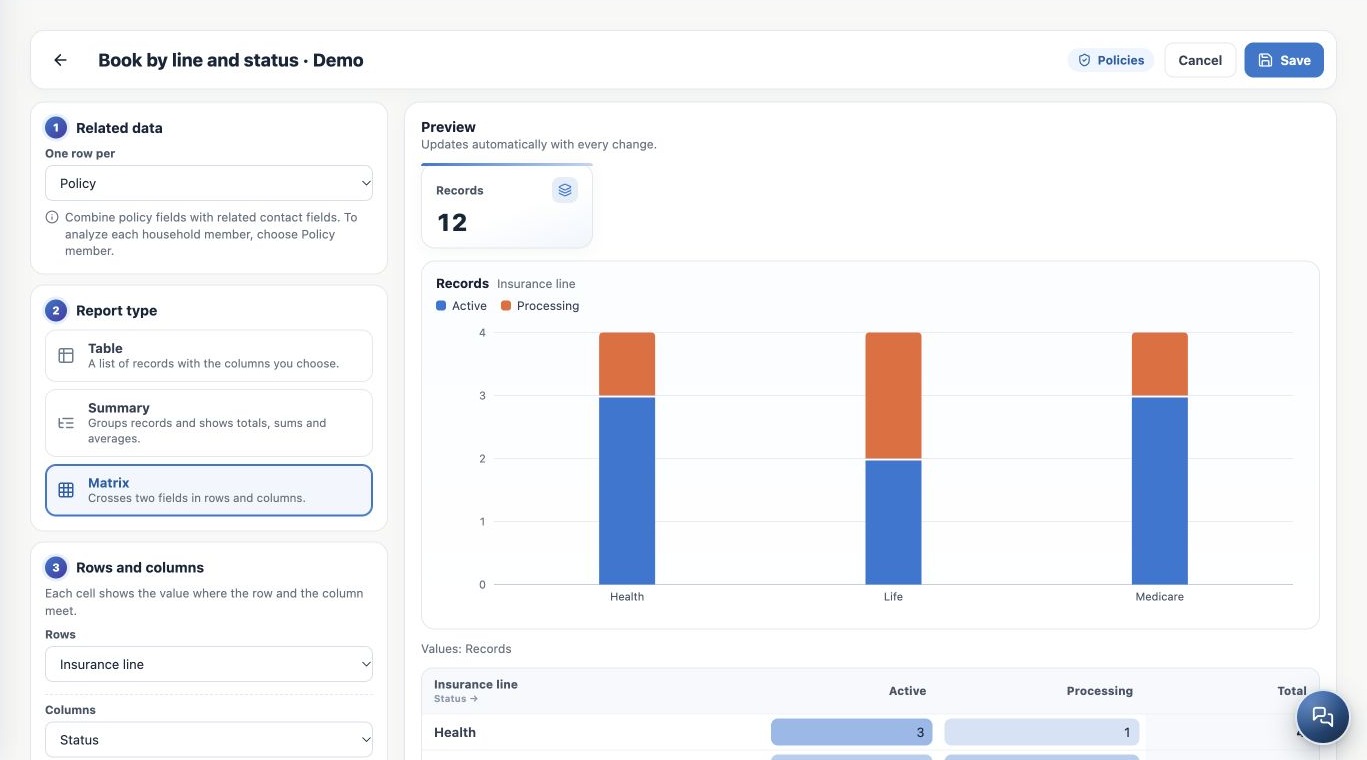
- Create a Policies Matrix.
- Choose Insurance line for Rows.
- Choose Status for Columns; two different groupings are required.
- Keep Records as the matrix and chart value.
- Add relevant filters and inspect the preview.
Read cells and totals
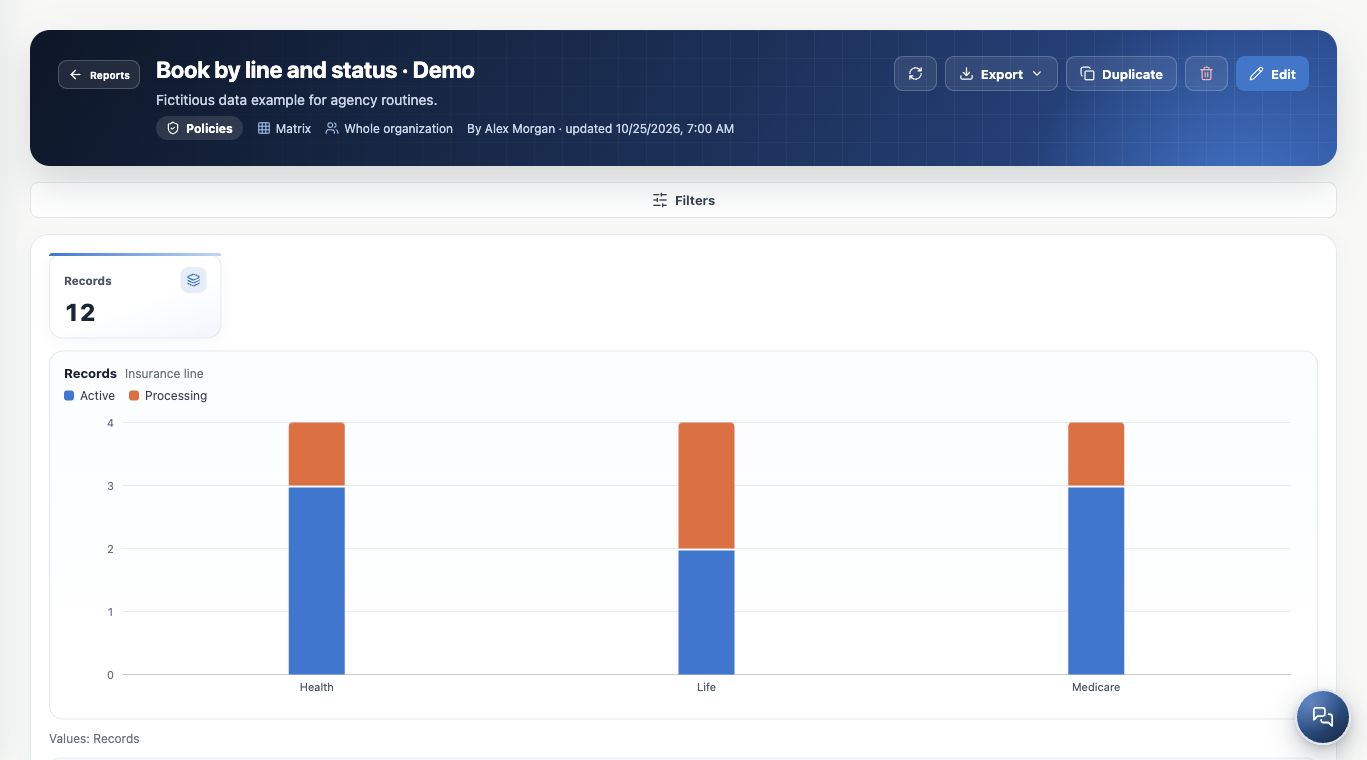
Each cell represents the intersection of a row and column. The 12 example policies are distributed across Health, Medicare and Life and Active or Processing status.
Row totals combine a product; column totals combine a status; the grand total covers the scope. Heat shading helps comparison. Selecting a monetary metric changes cells from counts to values.
Choose chart and value
| Chart | Use |
|---|---|
| Columns | Compare products or periods. |
| Bars | Compare carriers with long names. |
| Line | Chronological evolution. |
| Donut | Category share of a count or sum. |
| No chart | Prioritize the table or matrix. |
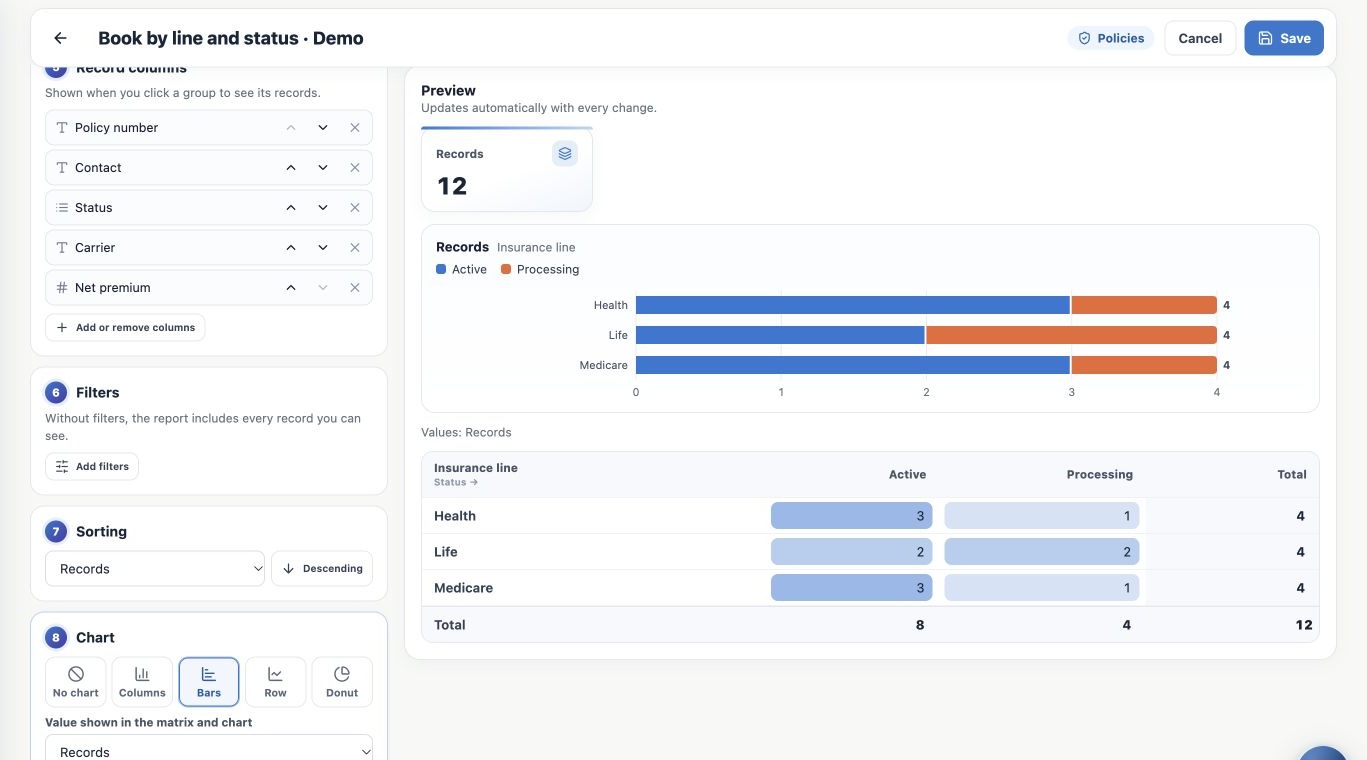
Charts require grouping. In Chart, select Records or an added metric for the displayed value. Donut is unavailable for averages, minima and maxima because these are not additive parts of a total.
Open underlying records
- Click an actionable group, cell, bar, point or slice.
- Check the side panel and record count.
- Use pagination and the configured record columns.
- Open a record to inspect its details.
- Close the panel to return.
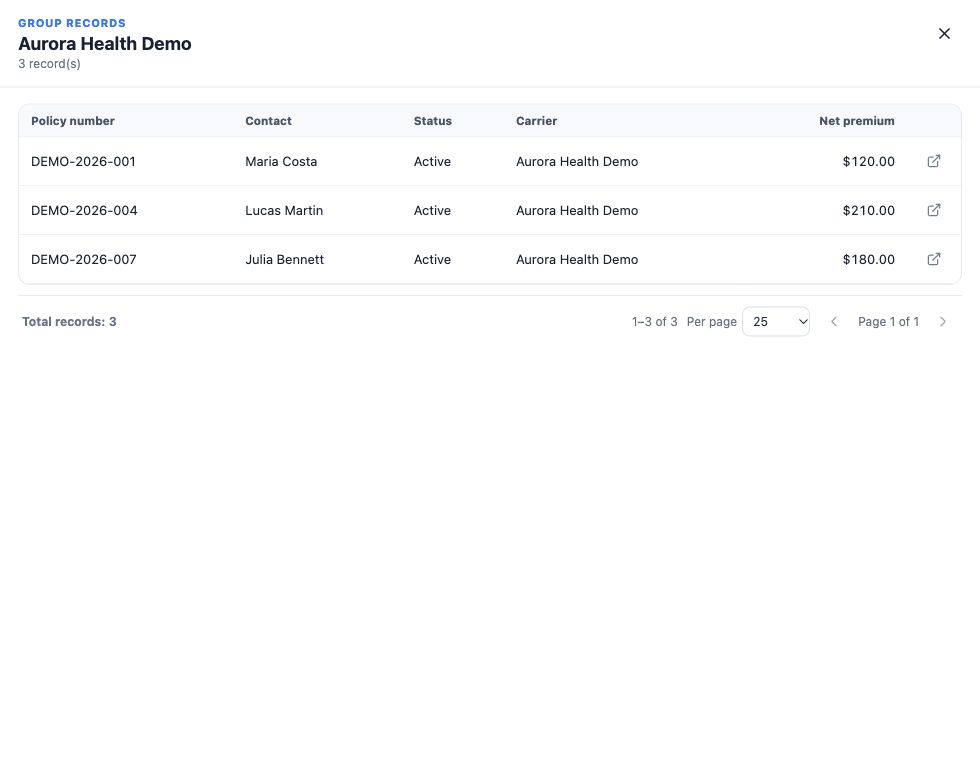
The image opens Aurora’s three active policies. Their premium sum is $510, while the panel contains three records: amount and count are different measures.
Recognize aggregates and limits
Charts with many categories may combine some into Other or leave remaining groups in the table. Investigate individual categories or refine filters to inspect the components of an aggregate.
Large-group warnings mean the result was limited. Prefer status, product, carrier or owner over thousands of unique client names in a matrix. A cross-tab is not evidence of historical journey conversion.
Keep learning
- Find reports and choose how to analyze your agency
- Build a policy table with columns and filters
- Create summaries with totals, averages and monthly trends
- Use related contacts and analyze policy members
- Save, share and maintain reports
- Export reports and resolve unexpected results
- Build KPIs and dashboards in Analytics
- Stay on top of your day
Updated October 25, 2026.