For: CRMDAY One users with the Insurance profile.
KPI, dashboard and home page
A KPI is a reusable query definition: module, calculation, dates, filters and appearance. A dashboard arranges KPIs in chosen sizes and order. The same definition can appear in several dashboards and on your personal home page.
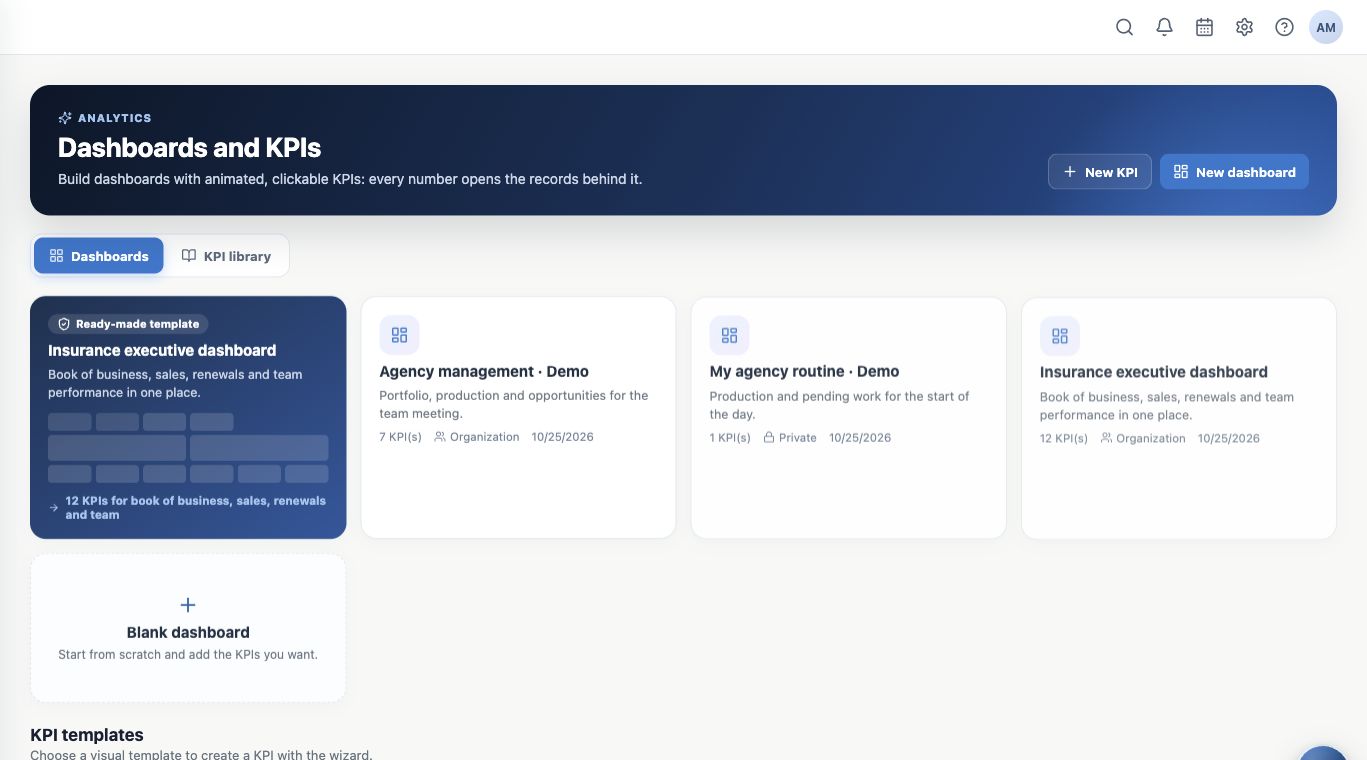
Open Analytics. Dashboards contains available collections; KPI library contains saved indicators. This section teaches creation and organization for an insurance agency.
Start with a business question
| Question | Definition |
|---|---|
| How many applications arrived this month? | Policies; count; Application date; This month. |
| What is active-book net premium? | Policies; sum Net premium; Active status; no date restriction. |
| Which carriers hold the book? | Active policies grouped by Carrier; count or premium. |
| Who owns this year’s applications? | Policies; count; Application date this year; Owner grouping. |
Count records for quantities; sum, average, minimum or maximum numeric fields for values. Policy premium does not automatically represent agency revenue, commission or profit.
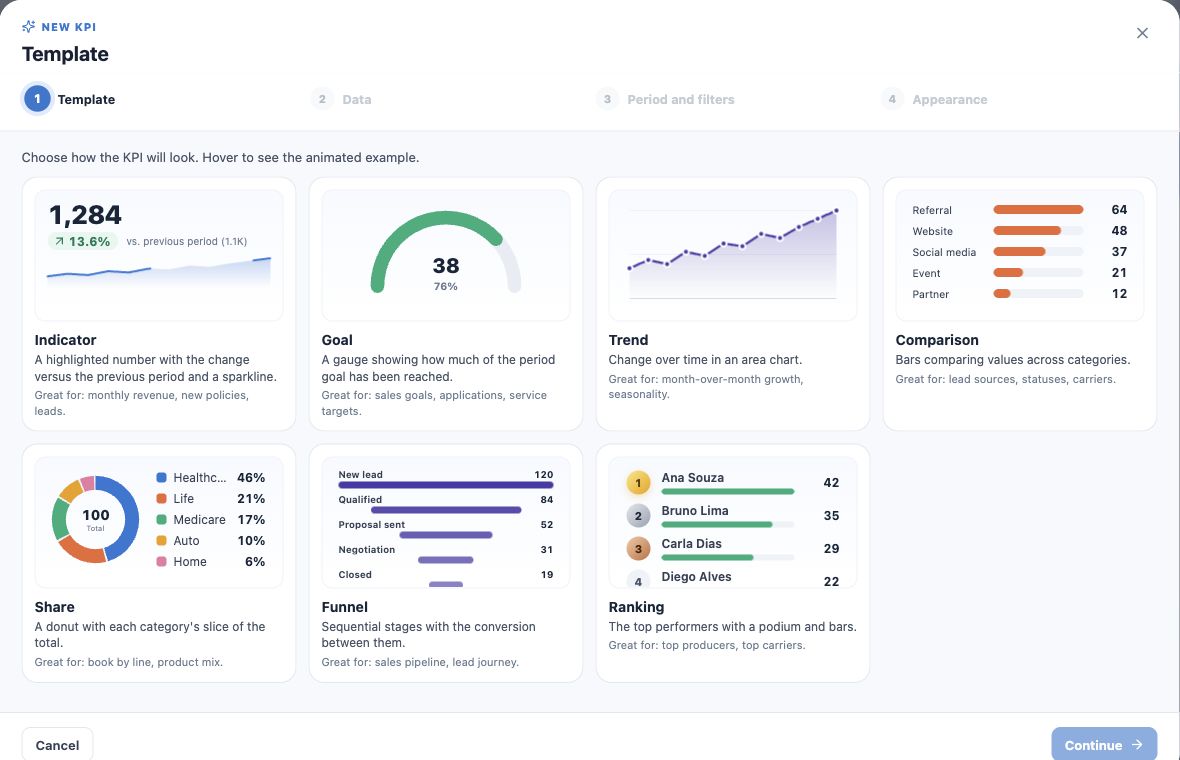
Choose among seven visuals
| Type | Use |
|---|---|
| Indicator | One number, such as monthly applications. |
| Goal | Actual versus target, such as 6 of 10. |
| Trend | Change over time. |
| Comparison | Category bars. |
| Share | Each category’s proportion. |
| Funnel | Distribution by stages. |
| Ranking | Leading categories or owners. |
Gallery examples illustrate appearance. The wizard preview queries accessible agency data, so its figures may differ.
Follow the four wizard steps
- Click New KPI or choose a gallery model.
- In Model, select the type.
- In Data, choose module, count or field value, grouping and Top N when offered.
- In Period and filters, choose the event date and range; configure comparison, target or granularity as appropriate.
- In Appearance, set name, description, color and visibility. Check placement and size when offered.
- Create the KPI, locate it in the library or originating dashboard and reopen it to verify saving.
Choose dates and filters deliberately
Application date measures application entry; Effective date measures coverage start; Expiration date helps examine upcoming renewals. Without a date field, all accessible matching records are considered.
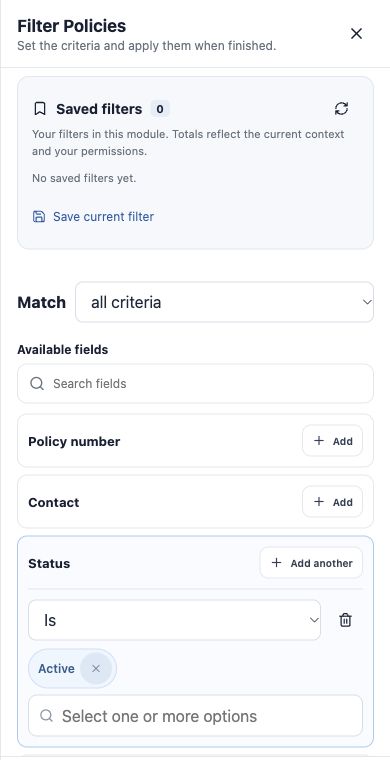
Use Add filters or Edit filters, choose field/operator/value and apply. All criteria combines conditions; Any criterion allows alternatives. The period still limits results even with Any. Recheck the preview.
Name the meaning of the number
Use names such as “Monthly applications — Application date” or “Net premium — active policies”. Describe important criteria. Agency-written names remain as entered when the interface language changes.
Validate by opening underlying records. If Continue is disabled, complete required dates, grouping or a positive target. The next guides provide recipes.
Keep learning
- Create numeric indicators and production goals
- Create application and renewal trends
- Compare carriers and show product share
- Create funnels and rankings for team follow-up
- Build custom dashboards and use the insurance template
- Put KPIs on your home page
- Review, edit and validate indicators
- Organize activities and processes with Kanban
- Stay on top of your day
Updated October 25, 2026.