For: CRMDAY One users with the Insurance profile.
Recipe: active book by carrier
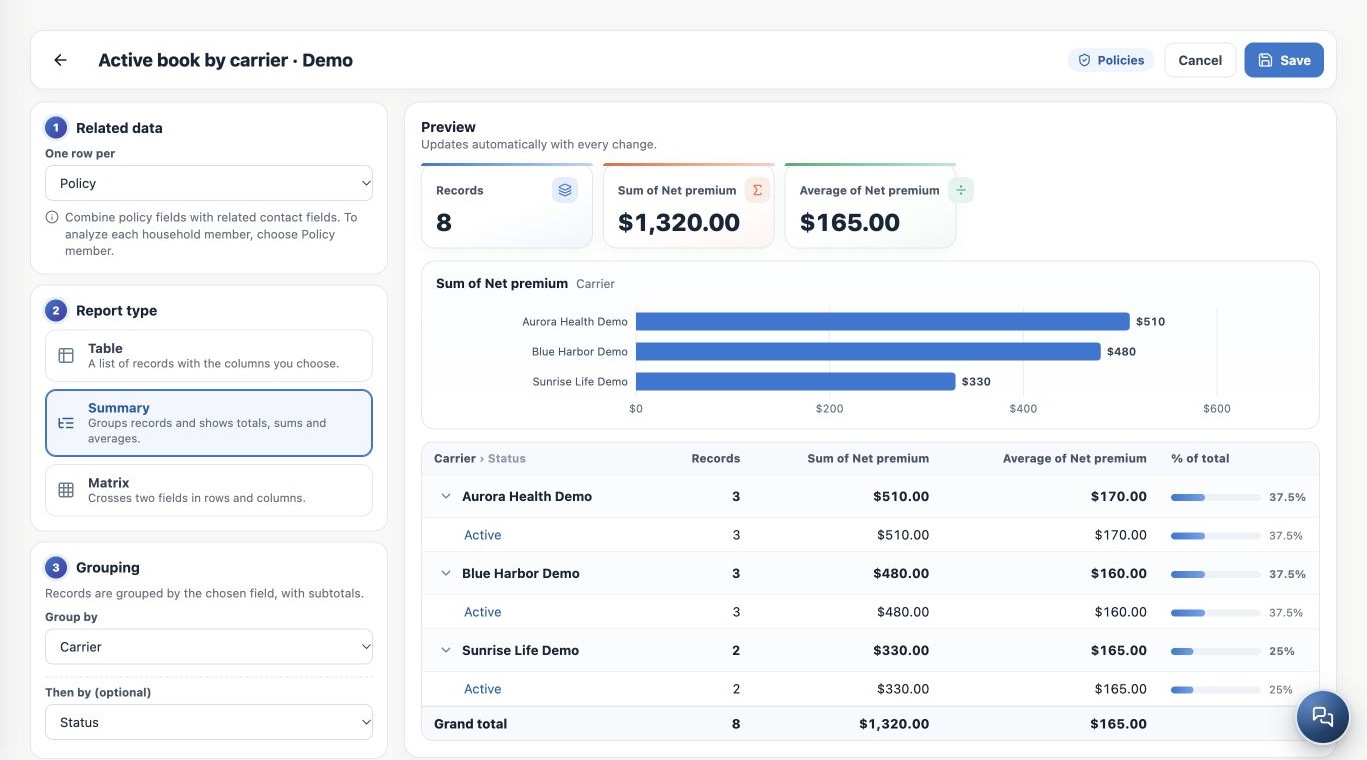
- Create a Policies Summary.
- Group by Carrier; optionally choose Status for Then by.
- Filter Status = Active.
- Keep the automatic count and add Sum of Net premium. Add Average of Net premium as another metric.
- Check the preview and save a clearly named definition.
Choose the appropriate calculation
| Calculation | Meaning |
|---|---|
| Count | Number of included records. |
| Sum | Total field value in the scope. |
| Average | Average across records with numeric field values. |
| Minimum / Maximum | Smallest / largest value in the set. |
Add up to six numeric metrics beyond the automatic count. Explicitly choose the intended field: Plan year is numeric, but summing years does not measure premium.
Read groups, subtotals and grand total
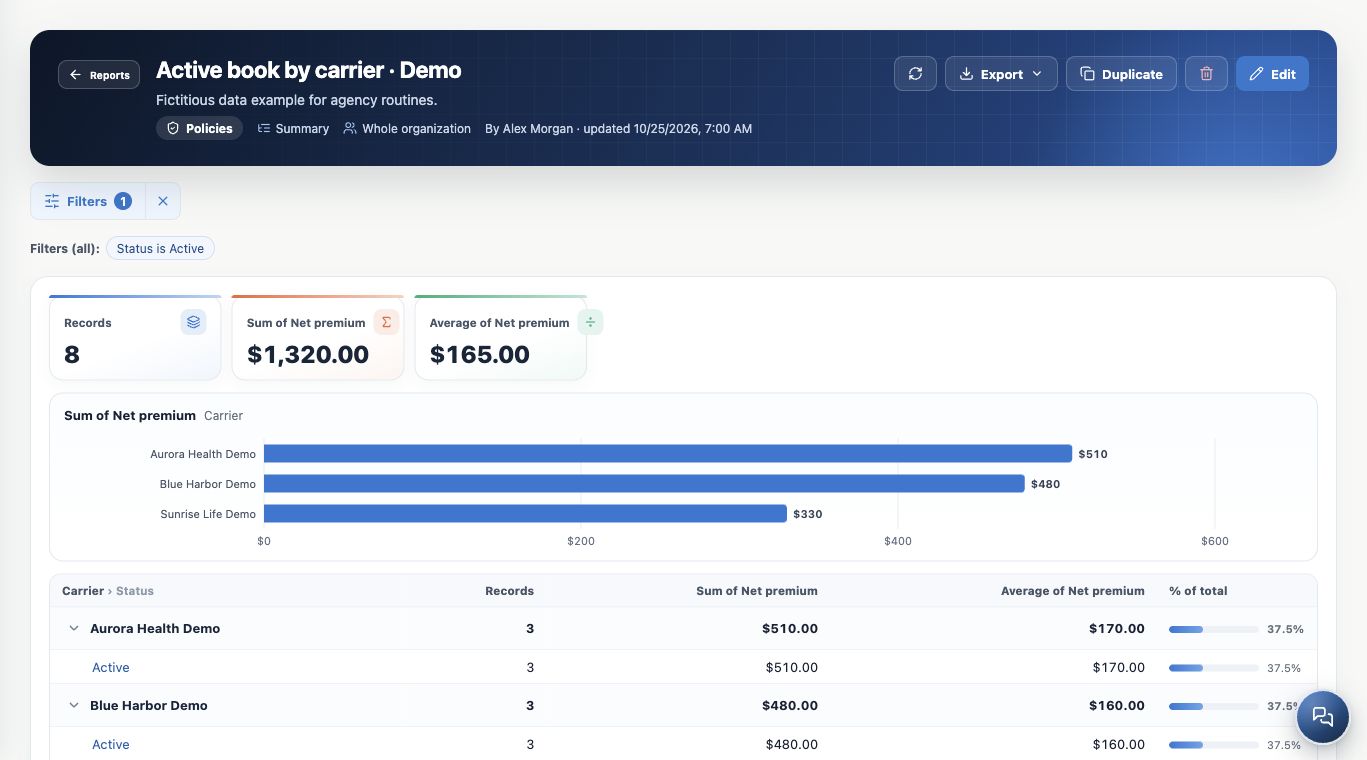
The example includes eight active policies: $1,320 net premium sum and $165 average. Aurora has three policies and $510, Blue Harbor three and $480, Sunrise two and $330.
Expand or collapse the second level. Do not add subtotals again to their children. The overall average comes from records, not an unweighted average of differently sized group averages. The table percentage represents record-count share. Premium is not automatically agency commission or revenue.
Recipe: applications by month
- Create another Policies Summary.
- Group by Application date and choose Month.
- Use date filters for the desired range.
- Choose Records for the chart value and Line or Columns.
- Sort groups in ascending natural order for a chronological series.
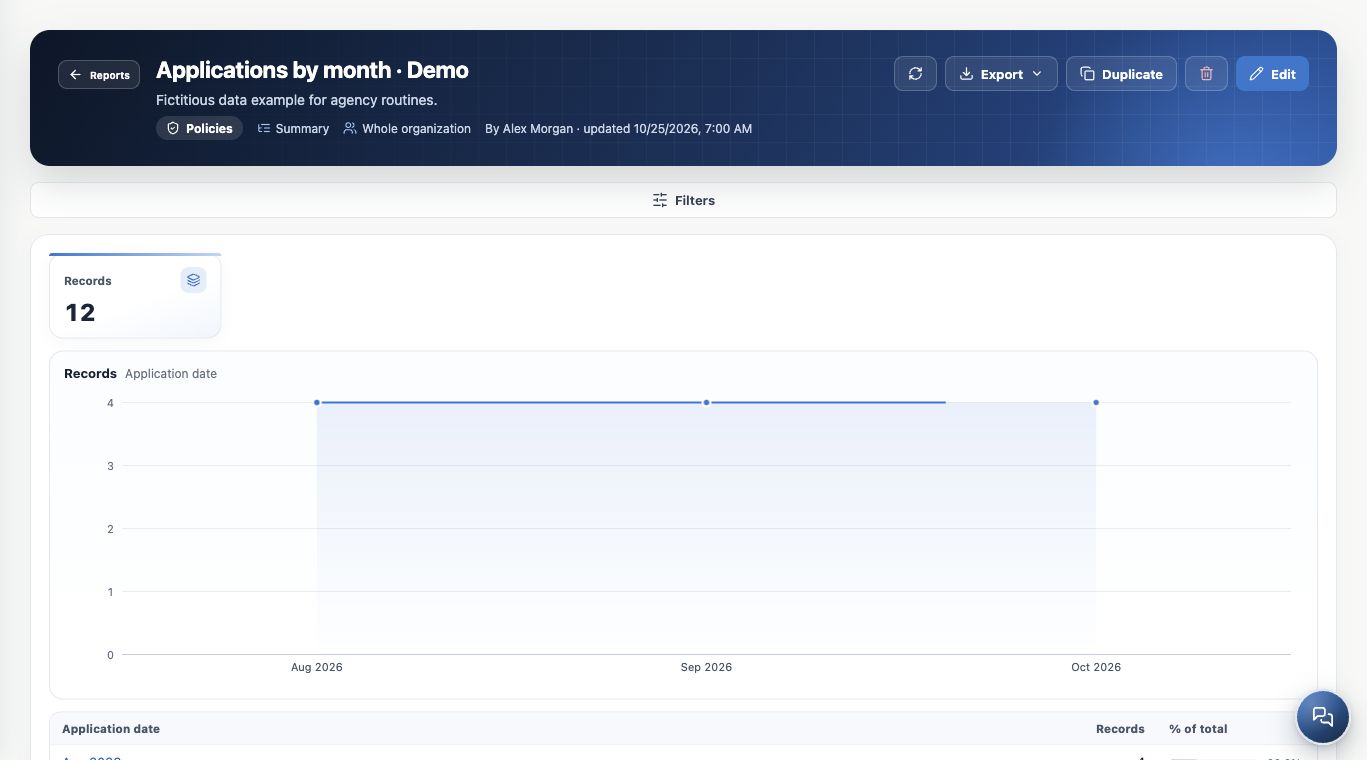
The image distributes 12 fictitious applications across August, September and October. Created at measures entry into the system; Application date measures the business event.
Validate before reuse
Click an actionable group or chart segment to inspect records with the original filters preserved. Check dates, status and values before presenting the analysis.
Date grouping supports day, week, month, quarter and year. Timestamps use the user’s time zone; date-only fields preserve the day. Keep the same criteria when comparing results.
Keep learning
- Find reports and choose how to analyze your agency
- Build a policy table with columns and filters
- Cross dimensions in matrices and explore charts
- Use related contacts and analyze policy members
- Save, share and maintain reports
- Export reports and resolve unexpected results
- Build KPIs and dashboards in Analytics
- Stay on top of your day
Updated October 25, 2026.