For: CRMDAY One users with the Insurance profile.
Define the event
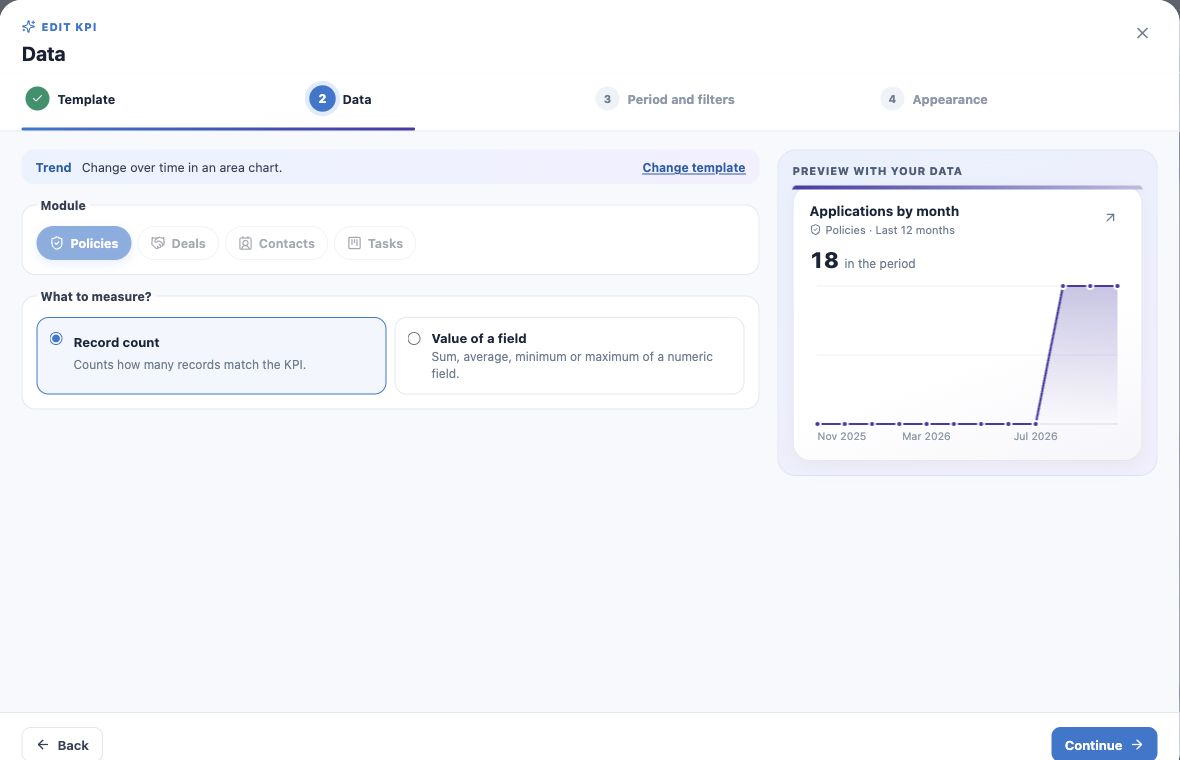
Trend answers how something changed over time. The example measures monthly applications by Application date. Effective date would answer a different question for the same policies.
A date field is required. For current active-book size, Indicator or Share is usually more suitable than an entry-date series.
Choose module and metric
- Choose New KPI → Trend.
- Select Policies and Number of records.
- For value trends, choose a suitable numeric field and calculation; this changes the question.
- Continue to Period and filters.
Set date and granularity
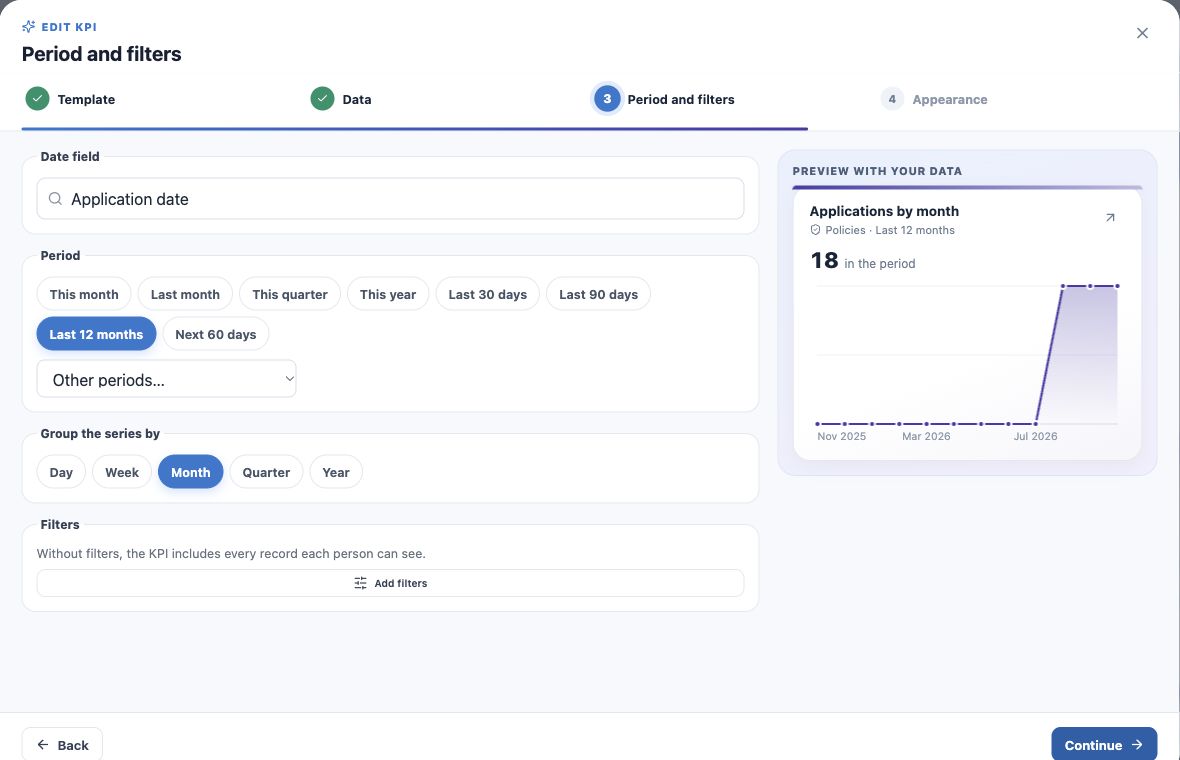
- Select Application date; verify the suggested field because the model can default to a different date.
- Choose Last 12 months.
- Group the series by Month.
- Add only the product/status/owner filters required by the question.
- Name it Applications by month — last 12 months and create.
Read and open a month
The example has 18 applications across August, September and October. Hover or tap to inspect a point and click to open that period’s records.
Grouping can be day, week, month, quarter or year. Zero points alone do not establish an import failure or access issue; check context and records.
Adapt to future renewals
Use Expiration date, a future range such as Next 60 days and an Active-policy filter to show upcoming expirations. Name it Planned expirations: it does not prove renewal completion.
For values, sum the appropriate field and explain its meaning. Expiration-date and application-date series measure different events.
Give the chart room
Use Large or Full width for many periods. If empty, check date-field values and whether the range includes them.
Document the definition and validate at least one point through its records. Dates and access follow the user’s context.
Keep learning
- Plan your KPIs and learn the Analytics wizard
- Create numeric indicators and production goals
- Compare carriers and show product share
- Create funnels and rankings for team follow-up
- Build custom dashboards and use the insurance template
- Put KPIs on your home page
- Review, edit and validate indicators
- Organize activities and processes with Kanban
- Stay on top of your day
Updated October 25, 2026.