For: CRMDAY One users with the Insurance profile.
Choose the question and unit
Comparison shows category differences in count or value. Share shows proportions of a filtered total. Both require grouping.
A portfolio by quantity differs from one weighted by premium. State the unit in the name.
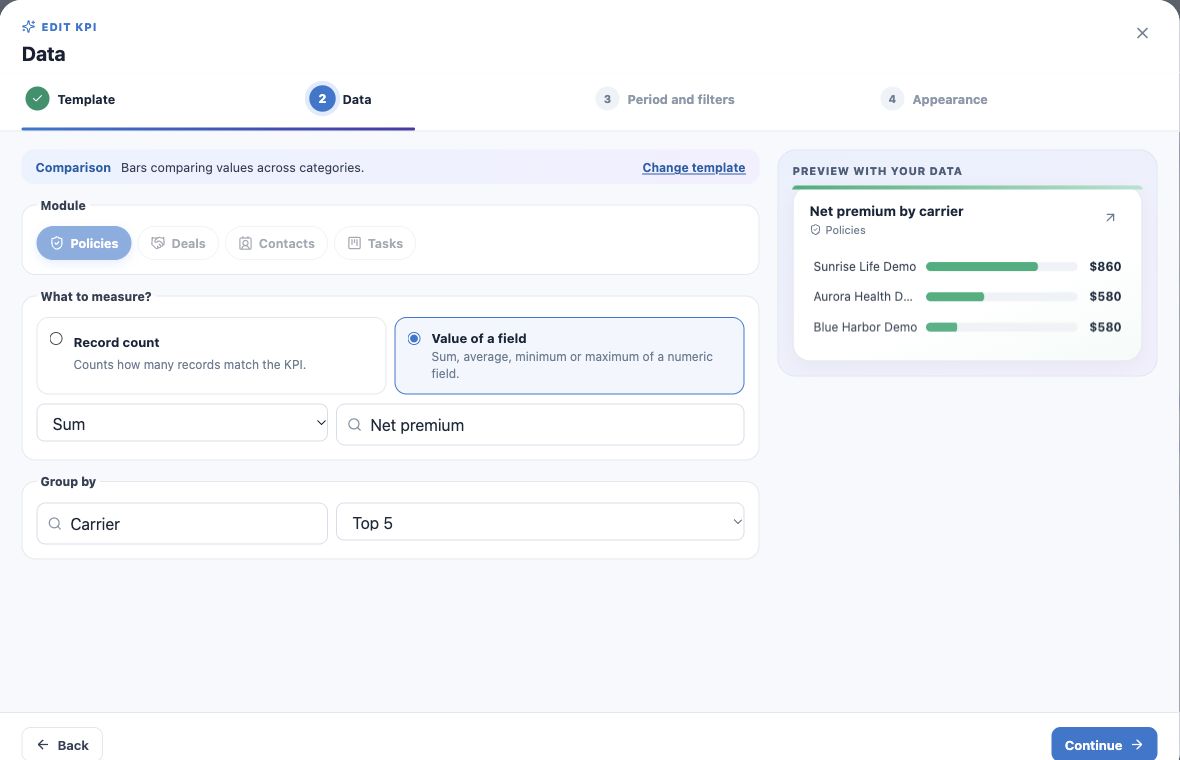
Recipe: net premium by carrier
- Create a Comparison KPI.
- Select Policies → Value of a field → Sum → Net premium.
- Group by Carrier and choose Top 5 when offered.
- Use no date restriction and filter Status equals Active.
- Name it Net premium by carrier — active book and create.
- Click a bar to inspect that carrier’s policies.
Interpret Top N
Top N limits displayed categories. With more carriers, adding visible bars may not equal the full universe. Increase the available limit or adjust the scope.
A larger bar means a larger selected metric, not better service quality or higher commission.
Recipe: active portfolio by insurance line
- Create a Share KPI.
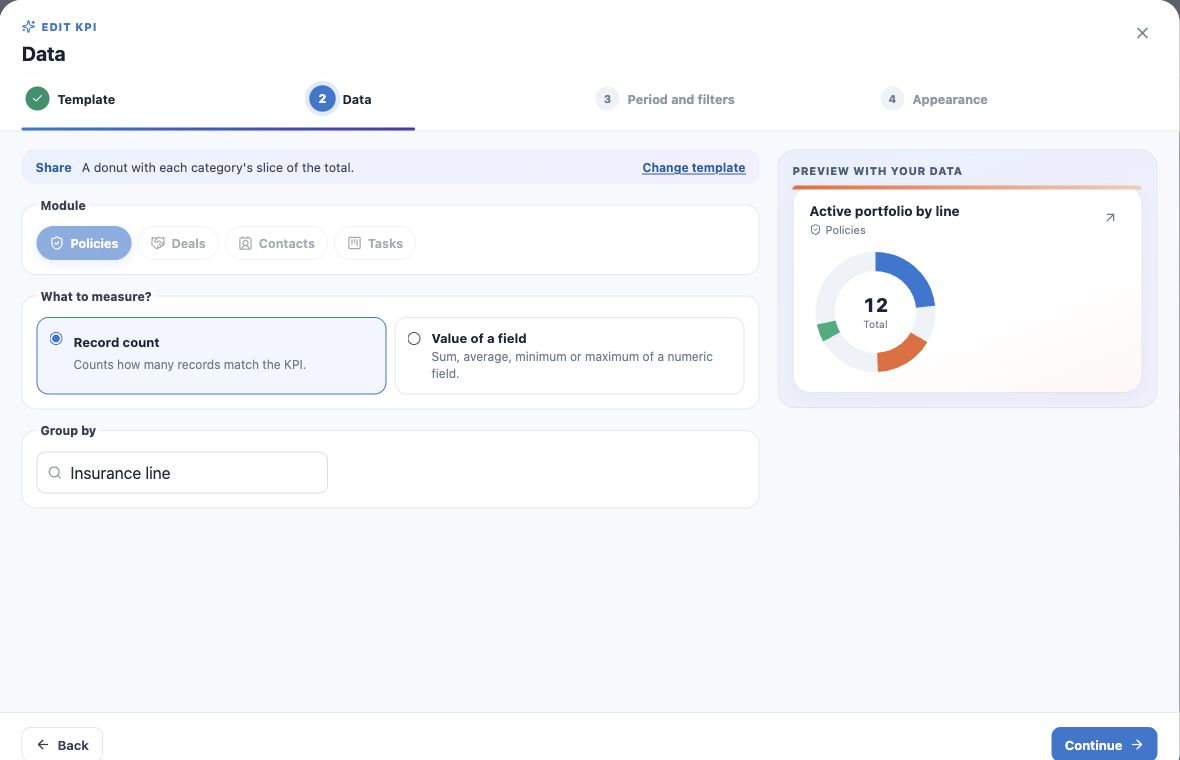
- Choose Policies and Number of records.
- Group by Insurance line.
- Use no date restriction and filter Active status.
- Name it Active portfolio by line and create.
- Check total, labels and percentages and open an actionable individual category.
Read slices and Other
The example divides 12 active policies across Health, Medicare and Life. Switching to premium sum changes the proportions to values.
Many categories may be combined into Other. Treat it as a summary; use actionable individual categories or adjust the indicator to inspect the components.
Reuse the pattern
- Lead sources: Contacts, count, Lead source and the intended creation period.
- Policy status share: Policies, count, Status, without filtering to one status only.
- Owner comparison: specify that Owner means the record’s responsible user.
Empty categories can indicate missing data rather than a new carrier or product.
Keep learning
- Plan your KPIs and learn the Analytics wizard
- Create numeric indicators and production goals
- Create application and renewal trends
- Create funnels and rankings for team follow-up
- Build custom dashboards and use the insurance template
- Put KPIs on your home page
- Review, edit and validate indicators
- Organize activities and processes with Kanban
- Stay on top of your day
Updated October 25, 2026.