For: CRMDAY One users with the Insurance profile.
Create a dashboard with a purpose
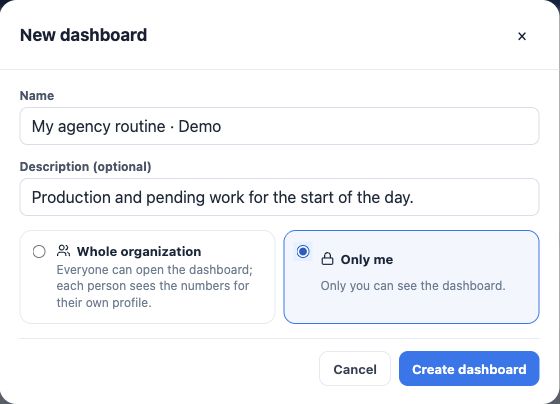
- In Analytics → Dashboards, click New dashboard or Blank dashboard.
- Enter a name such as My agency routine and a description.
- Choose Only me for personal validation or Whole organization for sharing.
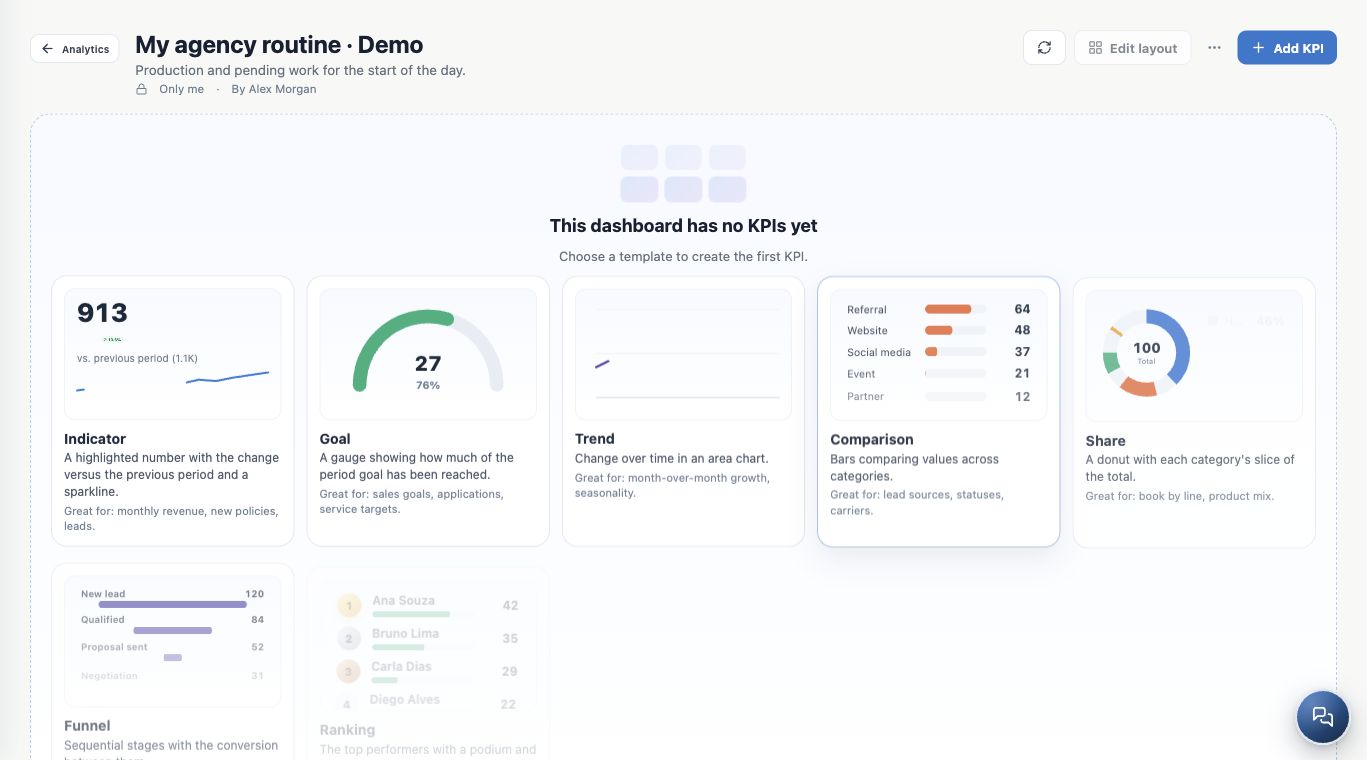
- Create it. An empty dashboard still needs KPIs.
Add an existing KPI
- Click Add KPI in the dashboard.
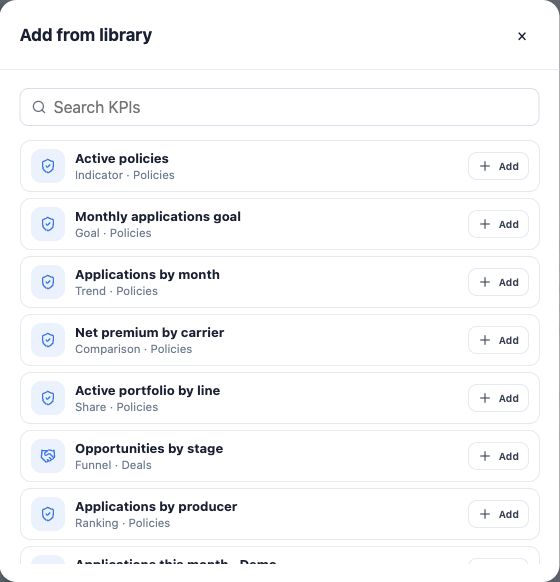
- Choose From the library.
- Search and add the desired item; included ones show On dashboard.
- Check its card. Reuse the definition in other dashboards without recreating it.


Create inside a dashboard
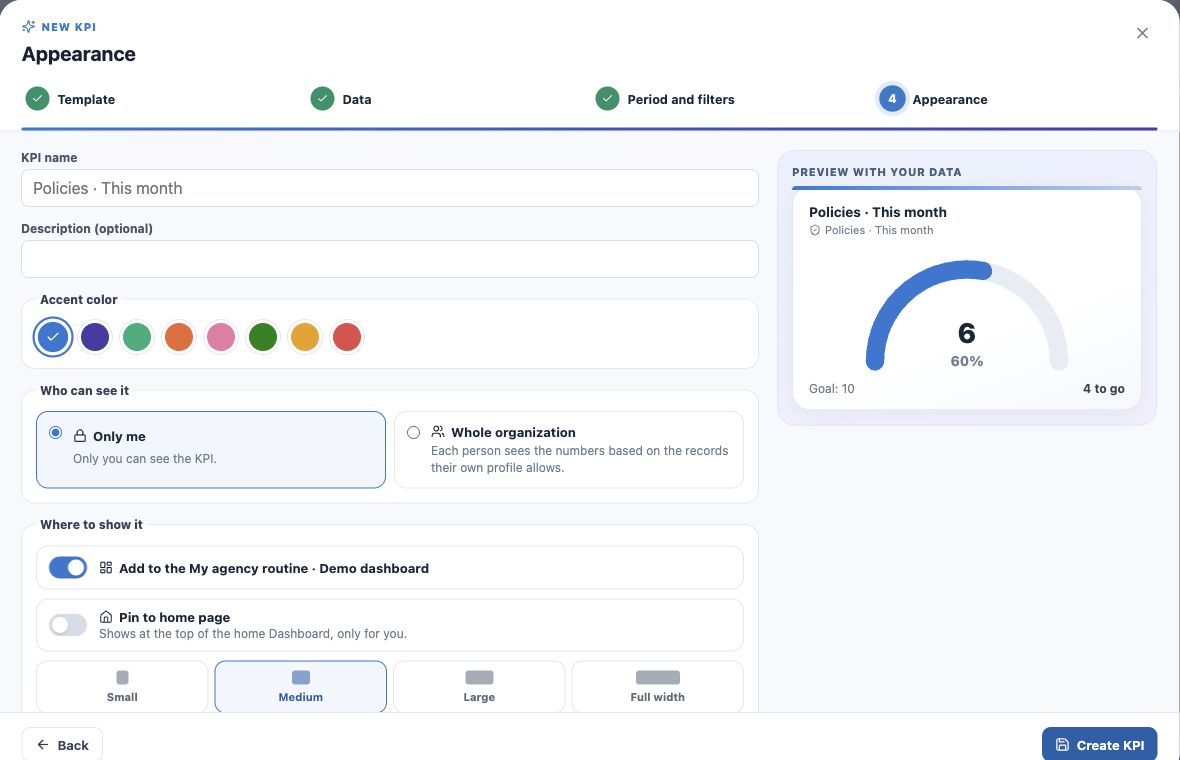
Choose Add KPI → Create new KPI and follow Model, Data, Period and filters, Appearance. At the end, check Add to dashboard … and the size.
Create and verify placement. Unchecking dashboard placement can save the definition only in the library. Pinning to home is a separate choice.
Arrange order and size
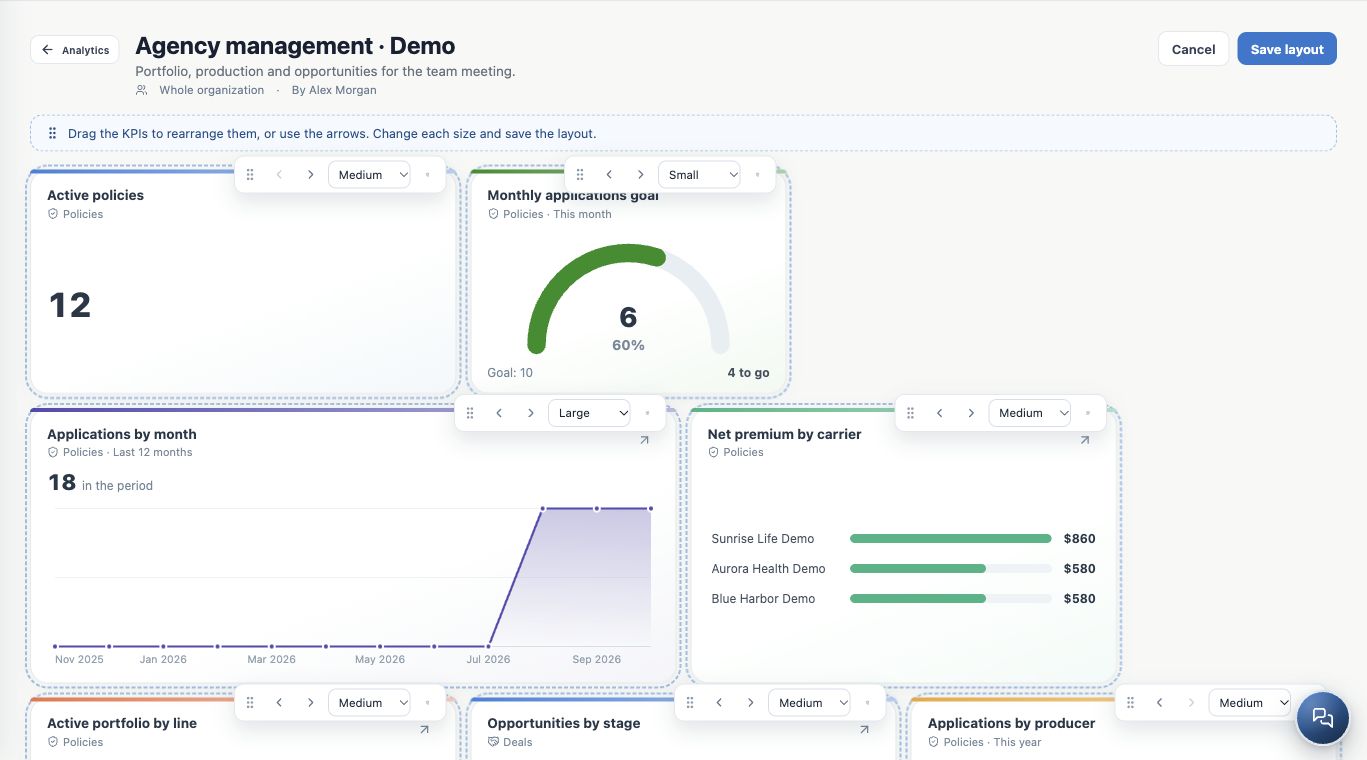
- Click Edit layout.
- Drag cards or use the arrow controls.
- Select Small, Medium, Large or Full width.
- Place key numbers first and give wider charts more space.
- Save layout, reopen and verify. Cancel discards the unsaved layout changes.
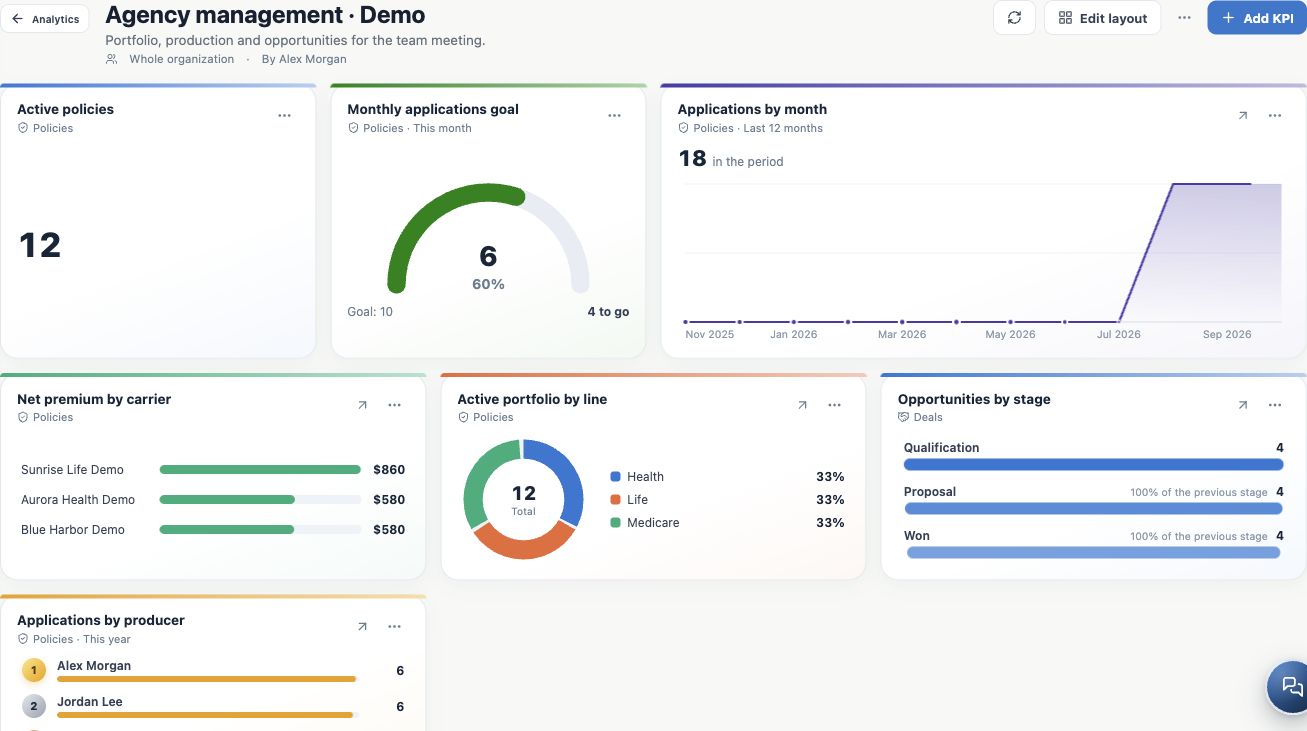
Start with the insurance dashboard template
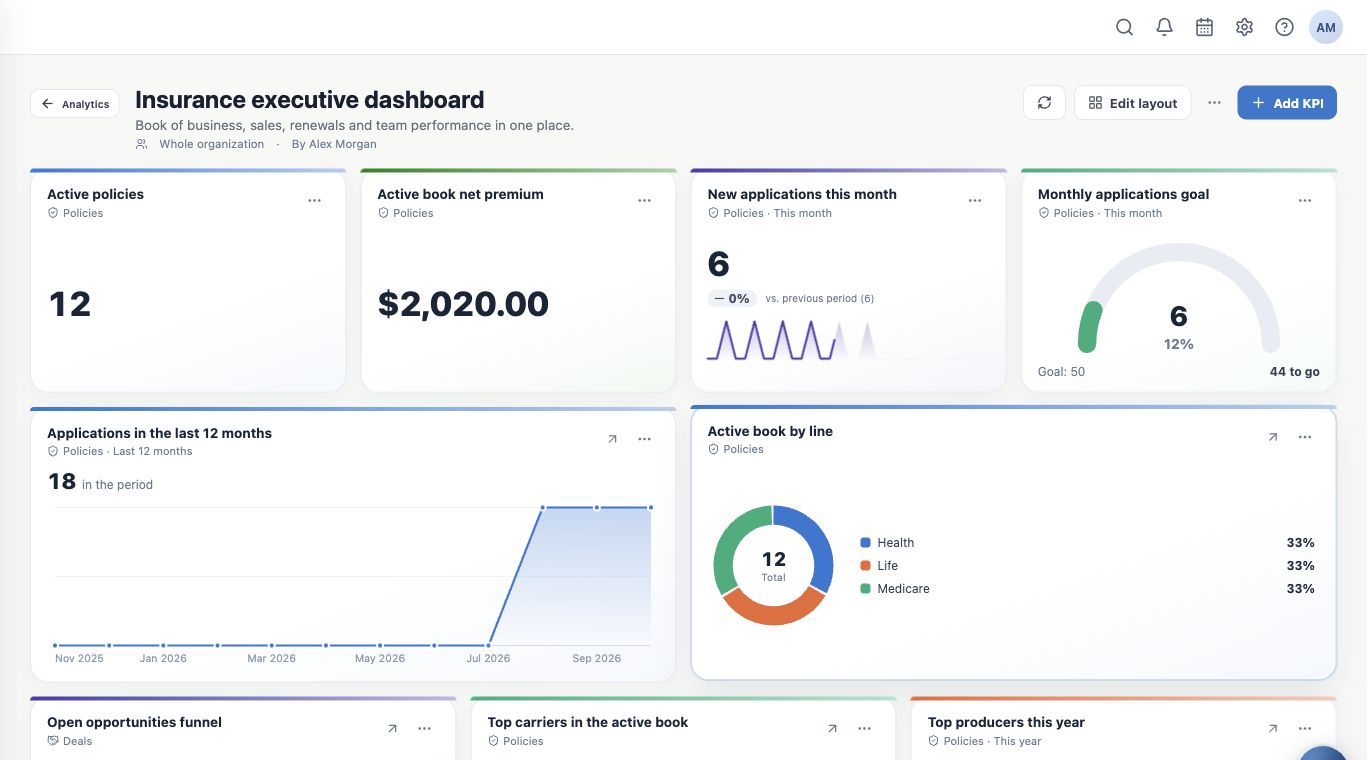
The Ready-made template — Insurance executive dashboard card creates an initial collection according to your available modules and fields. The standard template contains 12 KPIs for portfolio, premium, applications, targets, trends, products, opportunities, carriers, owners, leads and renewals.
Review dates, filters and targets before use. The initial target is an example, not an approved sales objective. The template creates configurations, not clients or policies.
Maintain shared definitions
Sharing a dashboard does not expose every private KPI or grant access to data. Each viewer sees only permitted modules, fields and records; some KPIs may remain hidden.
Rename through dashboard actions when allowed. Removing a card or changing its layout preserves the library definition. Editing the KPI changes the reused definition, so consider its other placements.
Keep learning
- Plan your KPIs and learn the Analytics wizard
- Create numeric indicators and production goals
- Create application and renewal trends
- Compare carriers and show product share
- Create funnels and rankings for team follow-up
- Put KPIs on your home page
- Review, edit and validate indicators
- Organize activities and processes with Kanban
- Stay on top of your day
Updated October 25, 2026.