For: CRMDAY One users with the Insurance profile.
Choose the consultation tool
| Area | Use |
|---|---|
| Dashboard | Start the day with portfolio and sales operations. |
| Analytics | Consult KPI dashboards and their scopes. |
| Reports | Consult saved lists, groups and module analyses. |
This guide focuses on ordinary-user consultation. Creating or editing definitions is a separate activity subject to access.
Open an Analytics dashboard
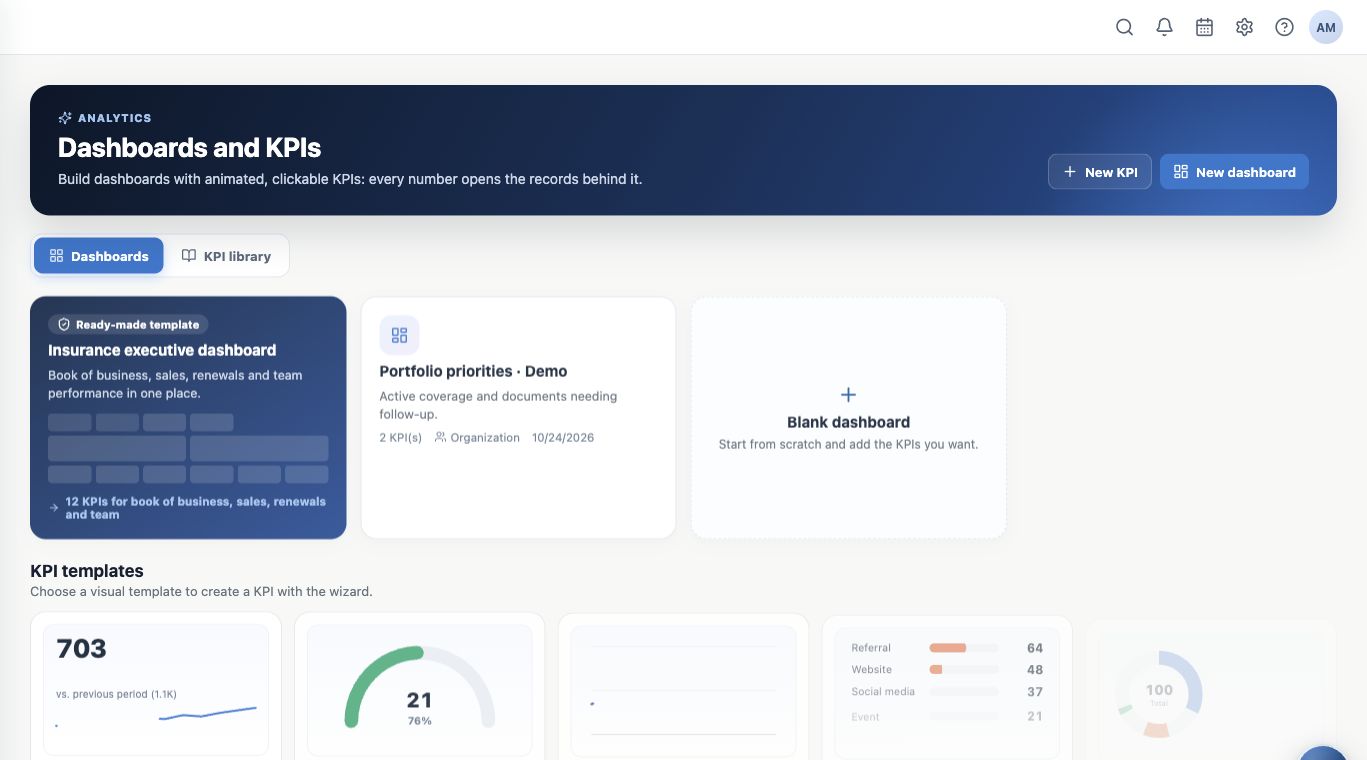
- Open Analytics from the menu.
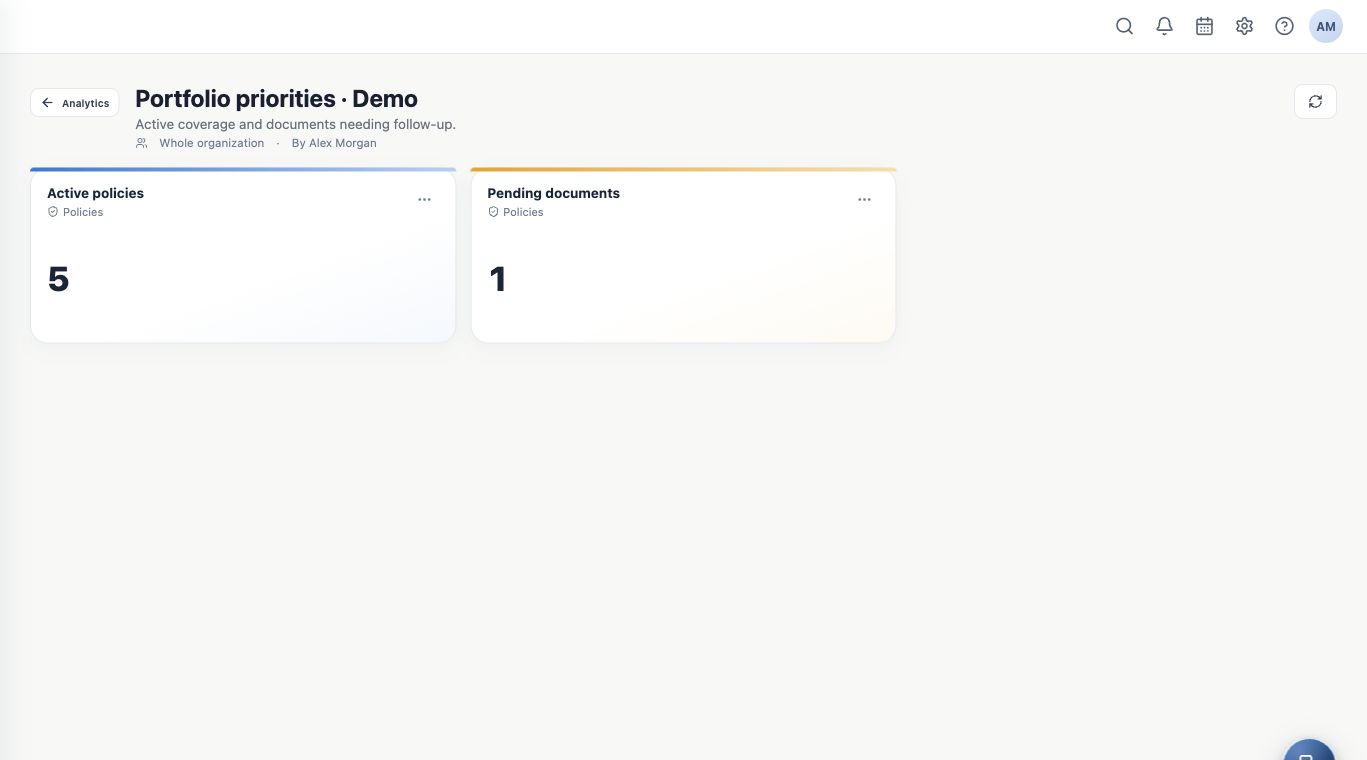
- In Dashboards, choose an available dashboard such as Portfolio priorities.
- Read KPI names, descriptions, modules, periods and filters.
- Use Refresh to query data again.
The KPI library contains available indicators. Templates create new definitions; you do not need a new dashboard to consult a shared one.
Inspect KPI records
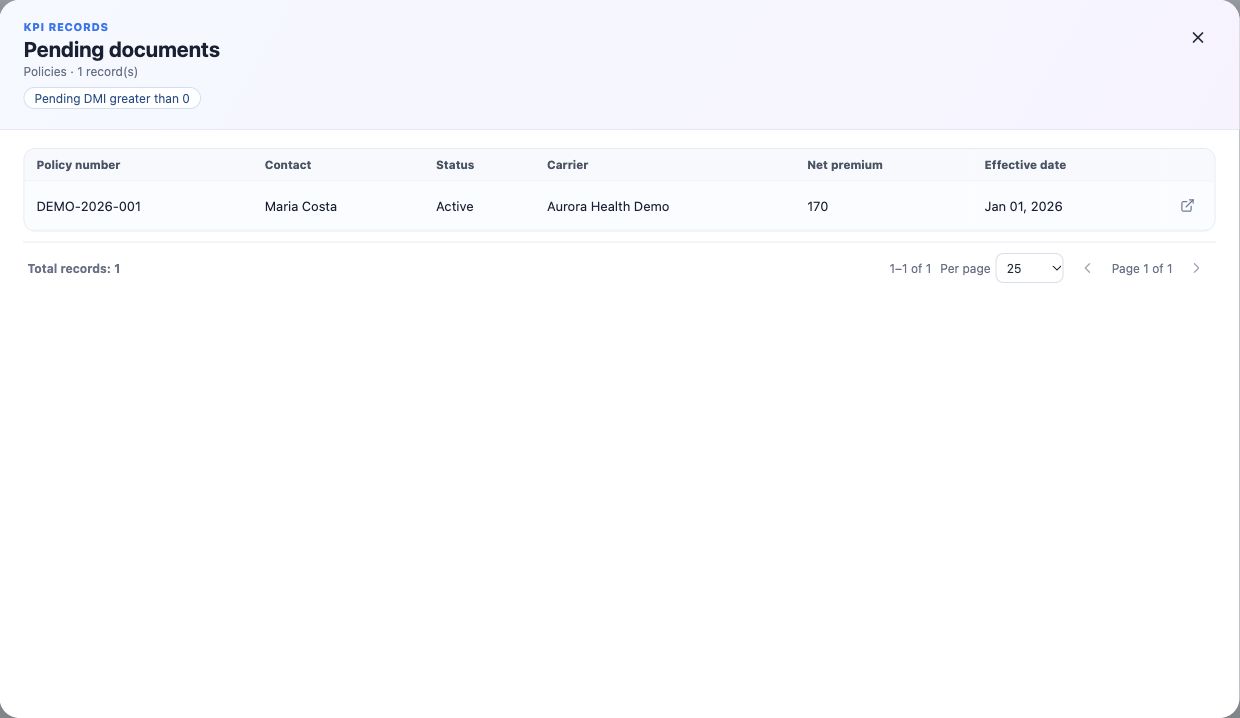
Click an indicator’s number or a chart segment. Review applied scope, count and pagination, then use Open record.
The example Pending documents contains one record with pending DMI greater than zero; Active policies contains five. Each KPI follows its own definition.
Find a saved report
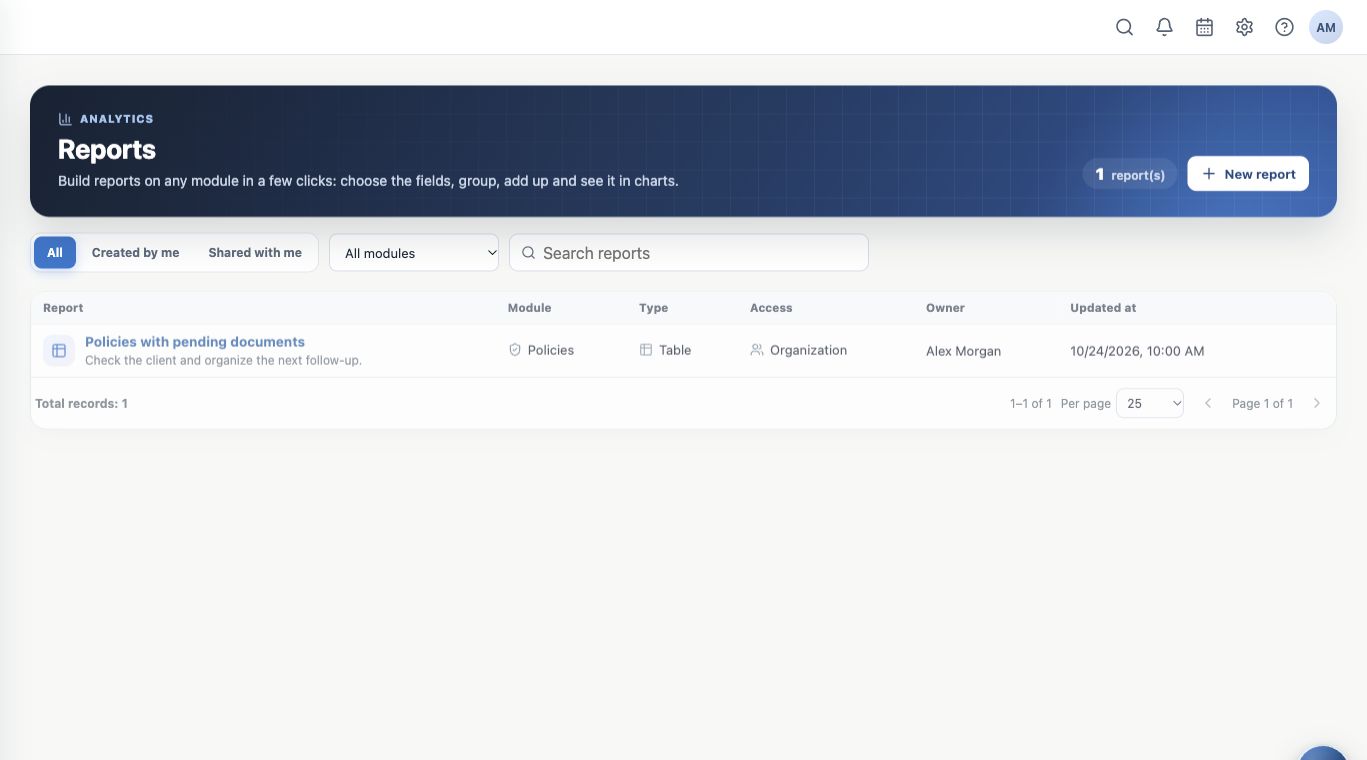
- Open Reports.
- Choose All, Created by me or Shared with me as needed.
- Select a module and search the name.
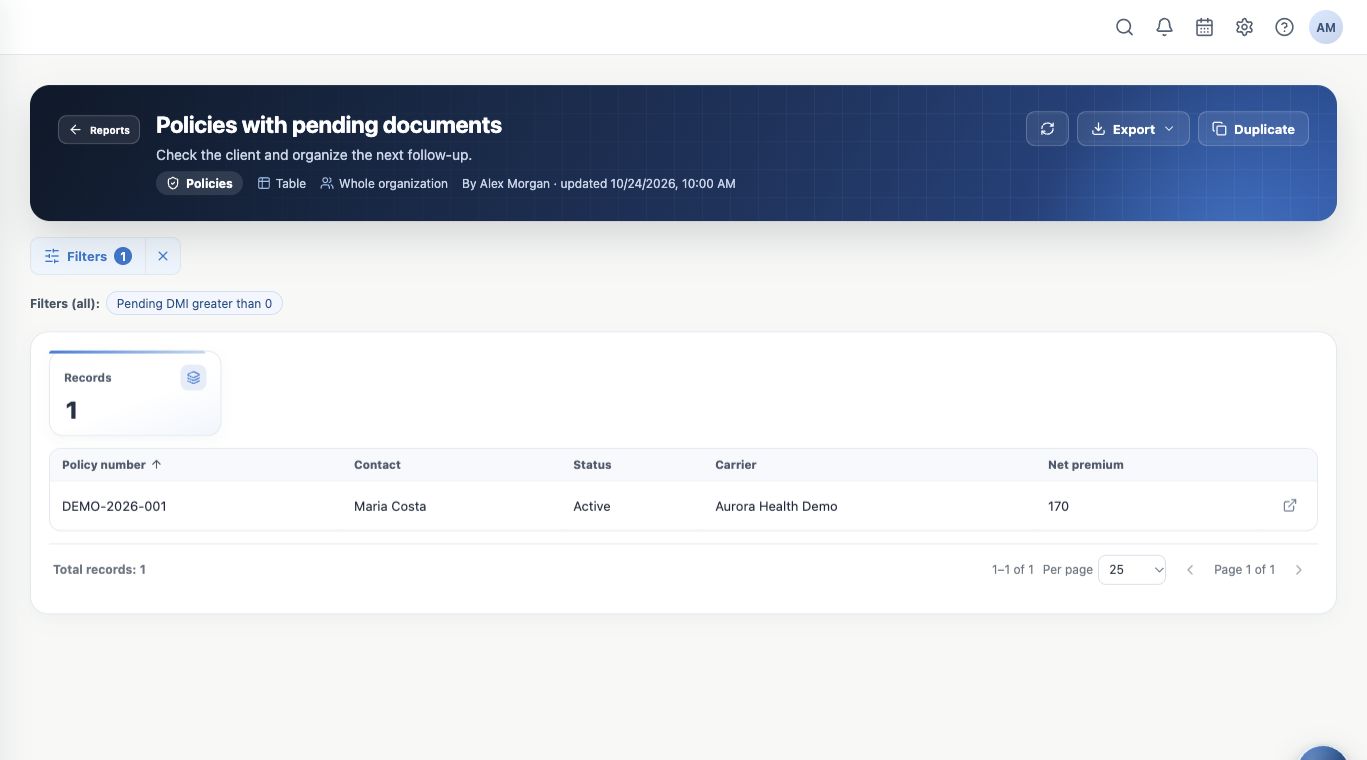
- Open the report, such as Policies with pending documents.
- Review conditions, columns, totals and pagination.
Adjust the query and export when available
Filters adjust the open report query. Check applied conditions and totals. Consulting another filter is different from editing and saving the shared definition.
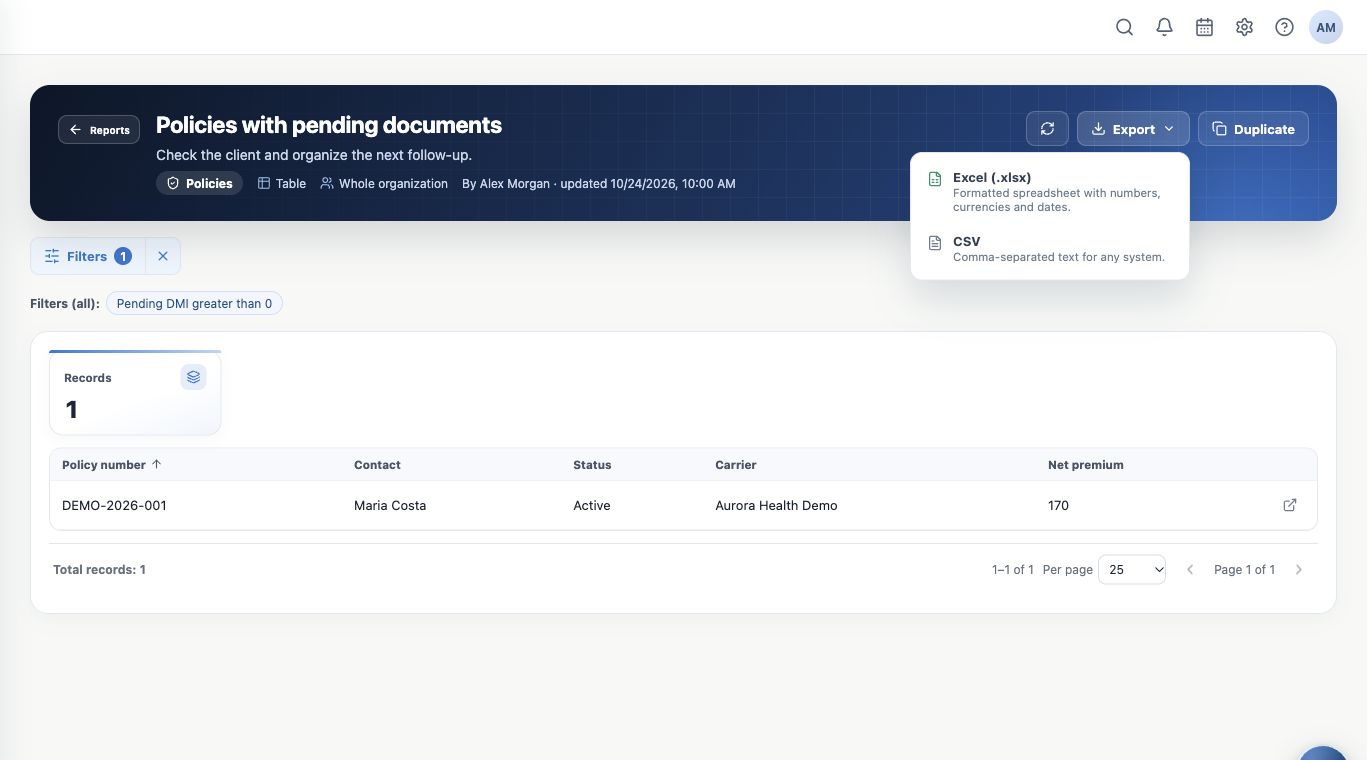
Export offers Excel (.xlsx) and CSV when available. Files reflect permitted query results and system limits. If a truncation notice appears, narrow the scope. Share files only with appropriate recipients.
Understand shared access
An organization-wide dashboard or report does not grant everyone access to every record or field. Each person sees data allowed by their profile. A dashboard may indicate that some KPIs are hidden.
For unavailable reports or indicators, ask the administrator to check module, sharing and access. Do not copy data to bypass restrictions. See missing information.
Keep learning
- Start your day with the Dashboard
- Use Book of business and Sales views
- Open clients and policies behind indicators
- Check why a record or feature is missing
- Organize activities and processes with Kanban
- Serve your clients
Updated October 24, 2026.