For: CRMDAY One users with the Insurance profile.
Choose by the question
| View | Main question |
|---|---|
| Book of business | Which coverage and pending issues need attention? |
| Sales | How are leads, opportunities and activities progressing? |
Both respect your record access. Their figures can differ because they measure different entities, events and periods.
Set the portfolio scope
- Select Book of business.
- Choose period, state, Producer/team and policy status as needed.
- Click Apply filters for these criteria.
- Use products to switch between consolidated and product-specific views. Selecting a product updates the view.
- Check the displayed context; Clear filters restores the initial scope.
Keep the same criteria when comparing figures.

Read portfolio indicators
Review active policies, covered people/risks, new business, monthly premium and renewal opportunities. People and policies are different counts: a policy can cover several people.
Product cards change the focus; Health may include metal-level details. Renewal opportunities refer to the next 60 days as stated on screen.
Consult Sales
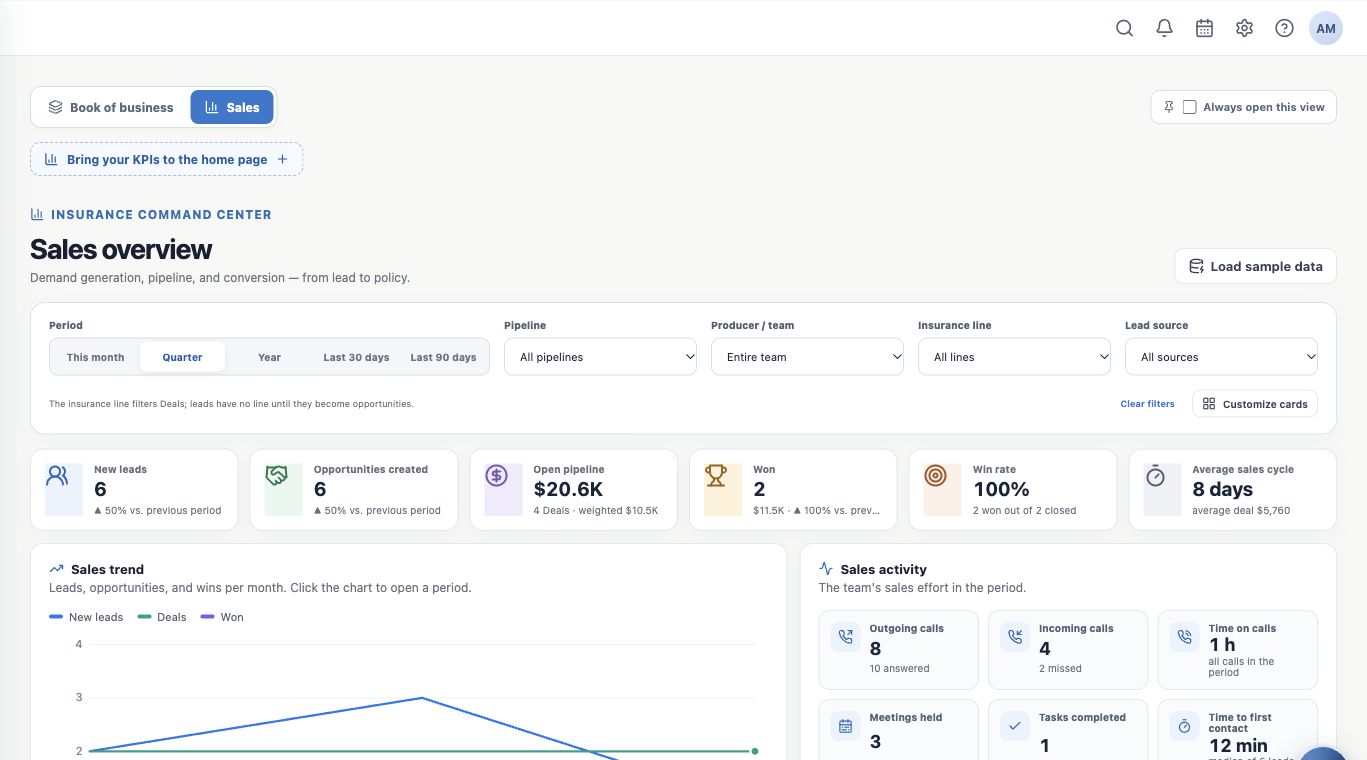
Select Sales and check period, pipeline, owner, insurance line and lead source as available. Sales has its own context; do not assume all portfolio filters carry over.
Indicators include new leads, opportunities created, open pipeline, wins, win rate and average sales cycle. An open pipeline is work still being negotiated. A won Deal and an active policy are distinct recorded outcomes.
Read the funnel and Kanban workload
In the funnel, Now shows current distribution; Period cohort follows that period’s group. Check which reading is selected.
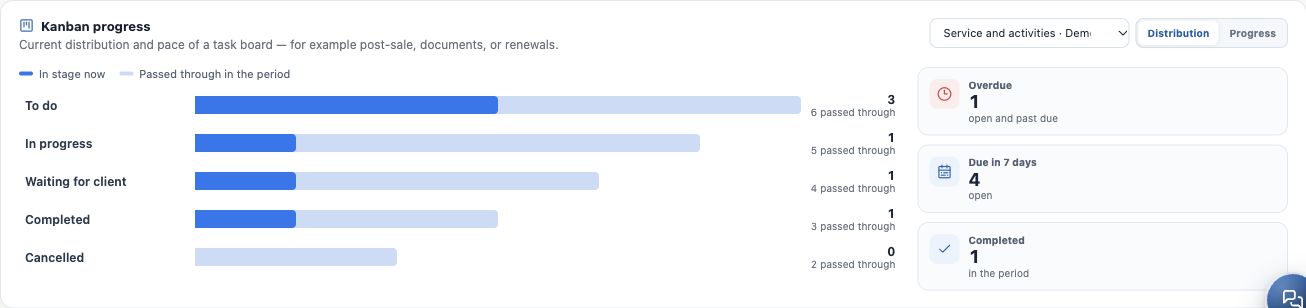
Under Kanban progress, choose a board and review distribution, stage passage and overdue or upcoming work. “Currently in stage” and “Passed in period” measure different things. Actionable counts open the associated work.
Decide the next action
- Portfolio: review documents, renewal or client status.
- Sales: plan the next contact and advance an opportunity after checking the result.
- Kanban: assign work, adjust deadlines and record progress.
See records behind indicators or missing records and features.
Keep learning
- Start your day with the Dashboard
- Open clients and policies behind indicators
- Consult Analytics and Reports available to you
- Check why a record or feature is missing
- Organize activities and processes with Kanban
- Serve your clients
Updated October 24, 2026.